search

Remote Continuous Survey LTE Logger (EU)SENTRY-G-LTE4 (EU) High performance 4G / LTE signal analyser & cellular logger

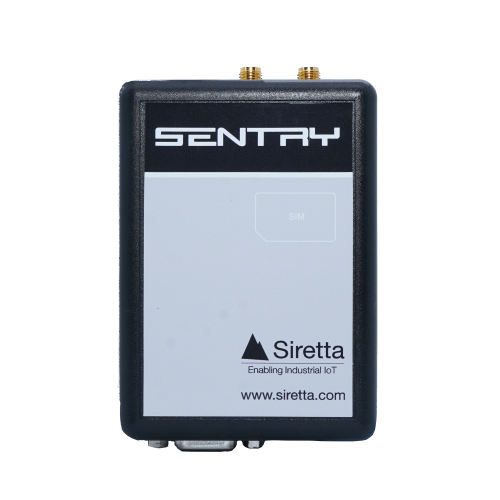
The SENTRY-G-LTE4 (EU) is a high performance, remote network signal analyser and cellular signal logger, dedicated to surveying and logging the 4G/LTE (EU), 3G/UMTS & 2G/GSM European networks.

The SENTRY-G-LTE4 (EU) is the latest release of Network Analysers that is monitored remotely.

The unit can be left unattended to conduct surveys in a fixed location and automatically saving them. Four types of survey can be performed: a “FULL” survey (4G, 3G and 2G combined), 4G/LTE only, 3G/UMTS only & 2G/GSM only. The SENTRY-G-LTE4 (EU) also has the capability to monitor cellular registration time, socket connection times, TCP/IP registration, Ping time and upload-download speed testing.

SENTRY-G-LTE4 (EU) can save multiple surveys each with different logging options and all survey results can be viewed using the CloudSURVEY portal to clearly show the logged detail over the survey session. This can identify unreliable base-stations & intermittent cellular service which is not possible with spot surveys.

The SENTRY-G-LTE4 (EU) is an invaluable tool for understanding local network performance over hours, days and weeks to assist in the selection of reliable mobile network operators before cellular installations.
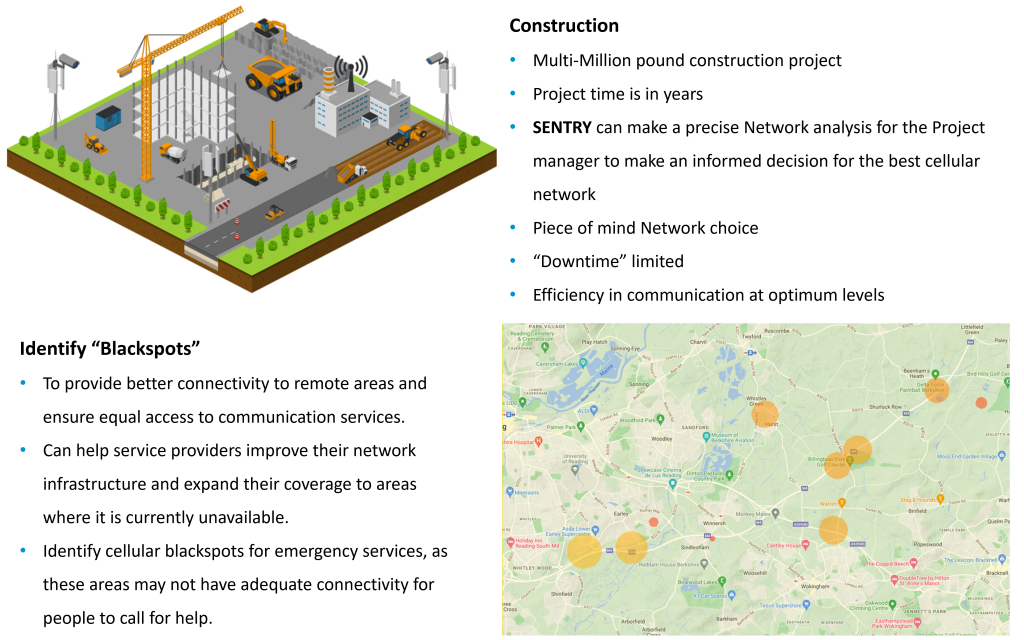
What can you do with the Siretta SENTRY

SENTRY Enhanced Features

  • Enhanced cellular surveying on LTE, 3G and 2G networks
  • Sequential logging of new and existing installations
  • User selectable survey logging options
  • Determine most suitable & reliable mobile operator
  • Evaluate “preferred” MNO’s performance over time
  • Determine cellular “hotspot” & “dropout” zones
  • Results are displayed clearly via the CloudSURVEY portal
  • Monitor network speed and performance

2G
GSM
3G
UMTS
4G
LTE
5~42V
Industrial
AUTO
SAVE Logs
Cell
ID
Cloud
SURVEY
EMEA
Europe
GEAR
Accessories
GNSS
Position
HTML
Reports
LOG
Surveys
MAP
Portal
MAP
Position
MNO
Summary
PING
Time
RS232
Serial
RTC
Timestamp
SCAN
Realtime
SIM
Required
Siretta
SPARK
TEMP
-40 to +85 C
USB
Serial
WEB
Portal
WIN
Linux/MAC


RoHS
Compliant
CE
Compliant
UKCA
Compliant
3g signal strength tester,4g network analyser,4g network base station detection,4g network signal logging,lte network analyser,lte network signal logging,lte signal strength tester,network signal logging, logger

CloudSURVEY Mapping Portal

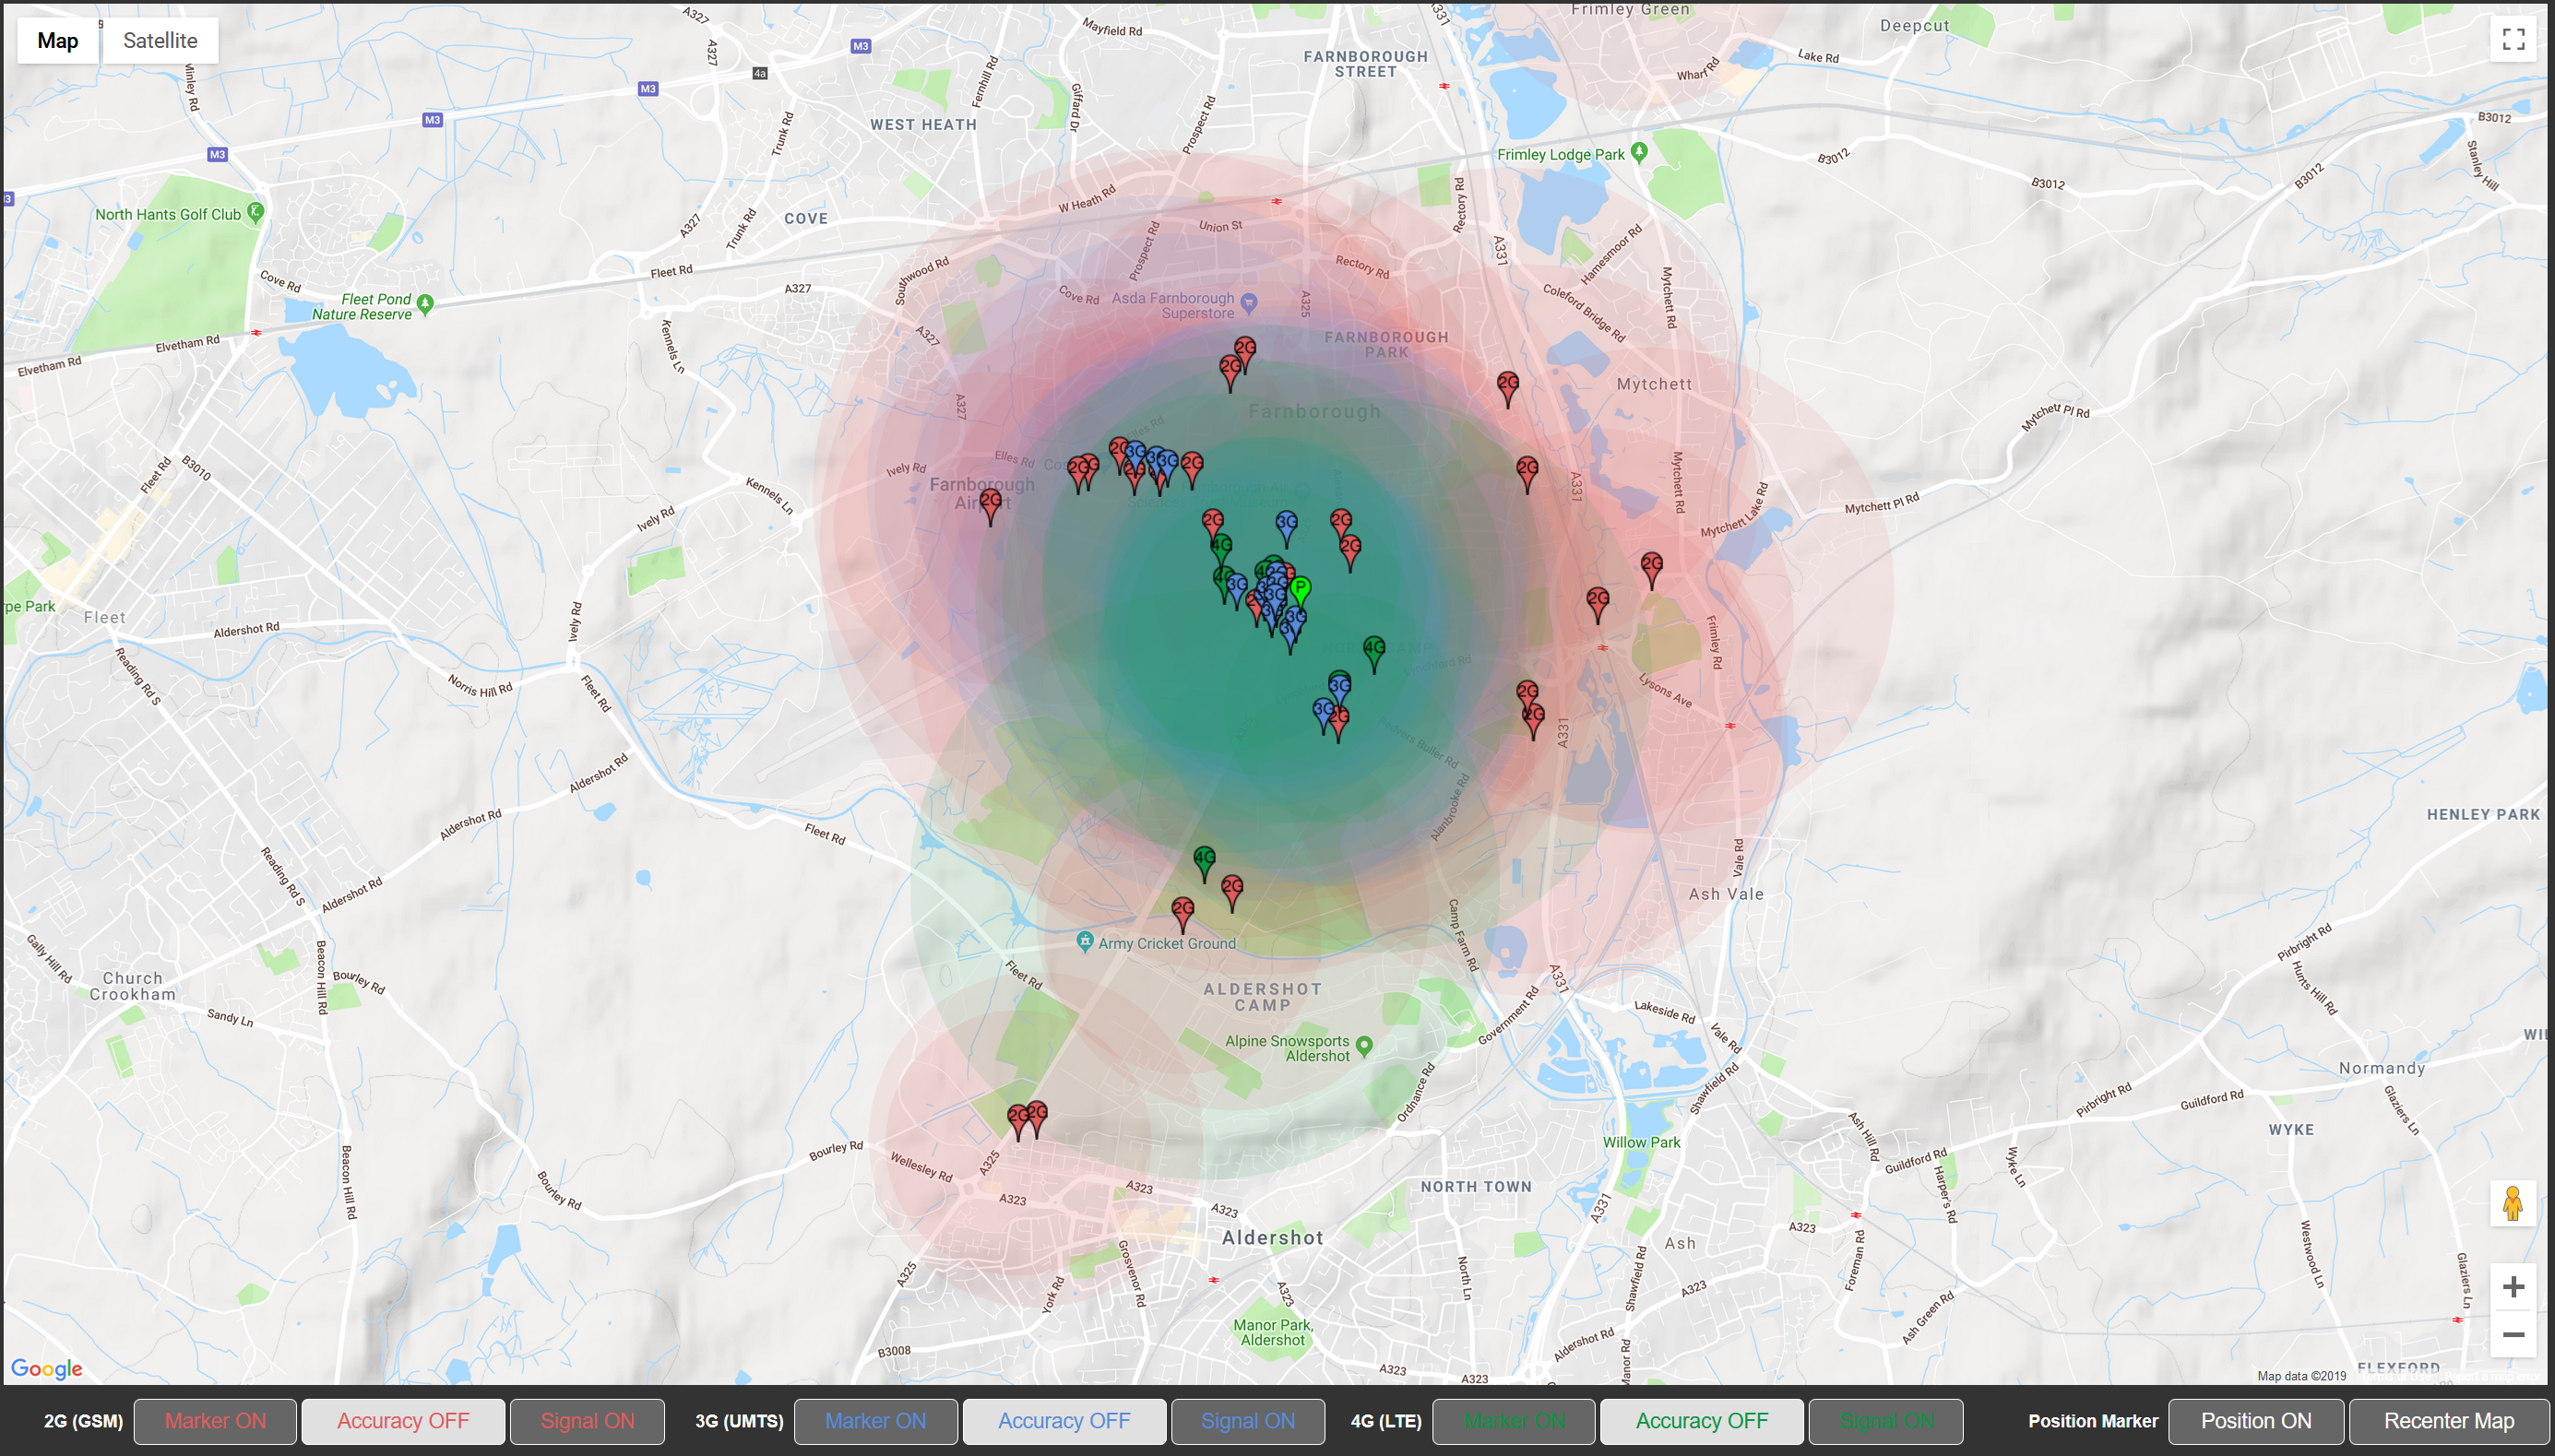
The SENTRY utilises the same CloudSURVEY mapping portal that the Siretta SNYPER series of handheld cellular signal analysers uses.
For more information and access the CloudSURVEY Portal, please click here
Furthermore, the SENTRY also offers a more detailed network performance survey analysis.

Performance Dashboard View

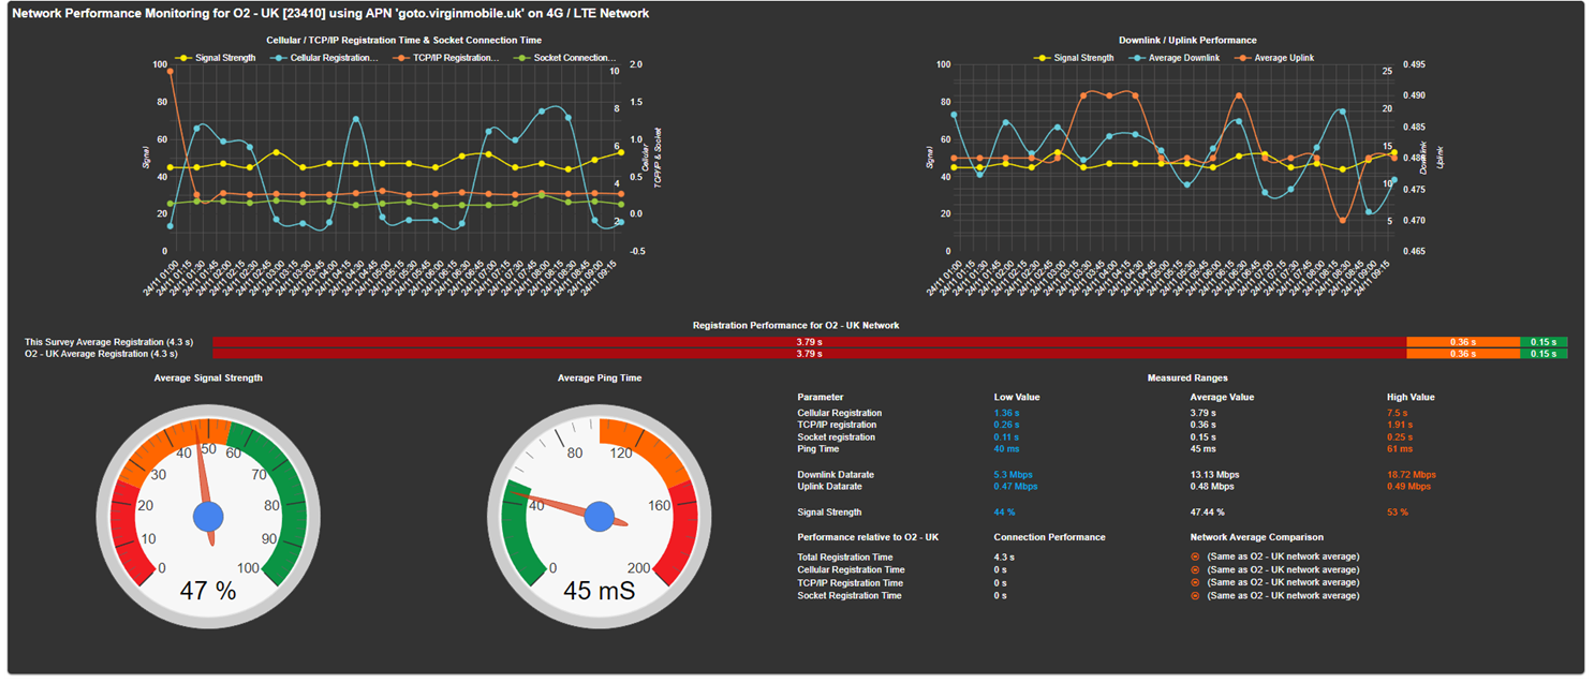
The CloudSURVEY Performance dashboard is a powerful tool that provide real-time insights into key performance indicators for cellular networks to aid data-driven decisions when choosing a cellular nework. This dashboard typically displays important metrics and data points such as TCP/IP Connection time, Ping/latency, Cellular Signal Strength and upload/download data rates for the user to understand the information at a glance.

SENTRY also shows a performance dashboard giving you detailed data of the cellular network that you are surveying.

SENTRY Device List View

The Navigation bar on CloudSURVEY is easy to use and very intutitive.

  1. Displays the current status of the SENTRY.
  2. Functionality to start and stop surveys.
  3. Configuration access to the SENTRY.
  4. Click to view all previous surveys.

SENTRY also shows a performance dashboard giving you detailed data of the cellular network that you are surveying.

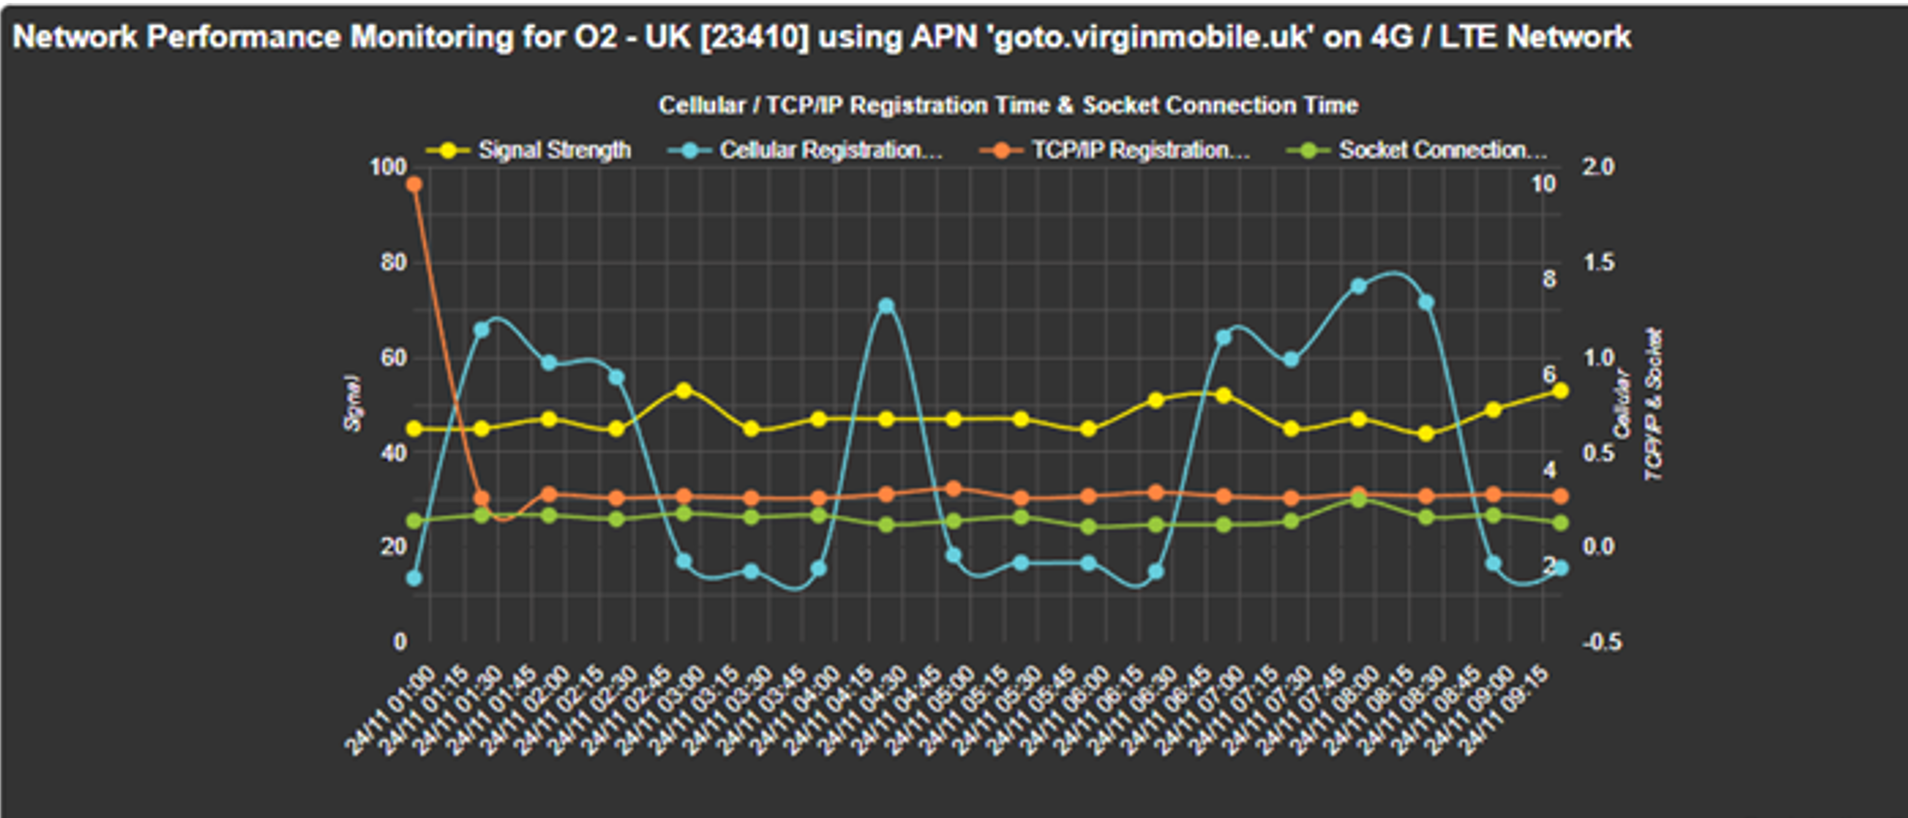
Cellular TCP/IP Registration, Signal Strength & Socket Connection Time

  • SENTRY Data for TCP/IP can be used to determine whether “connection time” is feasible for particular applications.
  • Applications include: Cash Payment systems, Transport timetable systems.
  • Any other applications that depend on fast network acquisition.

The entire performance and user experience of networked applications and services can be considerably impacted by a TCP/IP connection’s speed. The time it takes for the TCP/IP connection to establish can affect how quickly data is given to a user when they request it or interact with an application over the internet. Delays, timeouts, and a bad user experience can occur if the connection speed is slow.

This is crucial for time-sensitive applications like online gaming, video conferencing, and real-time financial transactions because even a slight delay can have a big effect on the result.

Applications employ sockets to create a secure connection for data transfer since they are the endpoints of a two-way communication route between two devices on a network. The duration of time needed to create a socket-based connection between two devices is referred to as socket connection time.

Network managers and developers can pinpoint potential bottlenecks, network congestion, or other problems that could impair the performance of their applications by measuring the time it takes for a socket to connect. With the use of this knowledge, they may enhance their programmes functionality and decrease connection time.

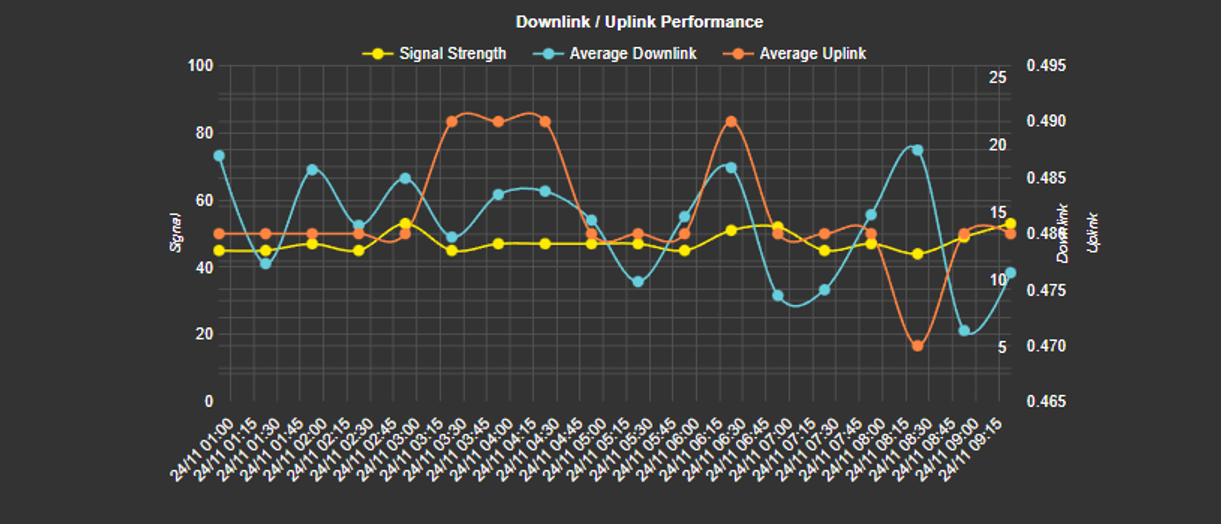
Downlink/Uplink Performance

  • Analyse downlink and uplink performance over time.
  • Analyse network behaviour at different times of the day.
  • Ideal for selecting a cellular network if perfomance is a main criteria.

It is crucial to assess downlink and uplink performance because it tells us how quickly and effectively data is transferred between networks and devices. Uplink performance describes the speed at which data is uploaded from a device to a network or server, whereas downlink performance describes the speed at which data is retrieved from a network or server to a device.

Users and network administrators can identify possible problems with network congestion, capacity restrictions, or other variables that may be affecting the speed and reliability of data transfer by measuring downlink and uplink performance. By using this data, network setups can be improved, bandwidth usage can be changed, and potential issues can be resolved.

The uplink and downlink measurements are taken over time which change throughout the day based on the network congestion and number of simultaneously connected users, the cellular signal integrity, the available internet bandwidth at both endpoints and the weather conditions. The averages are derived from the complete range of measured values and provides an overall average uplink and downlink data transfer rate.

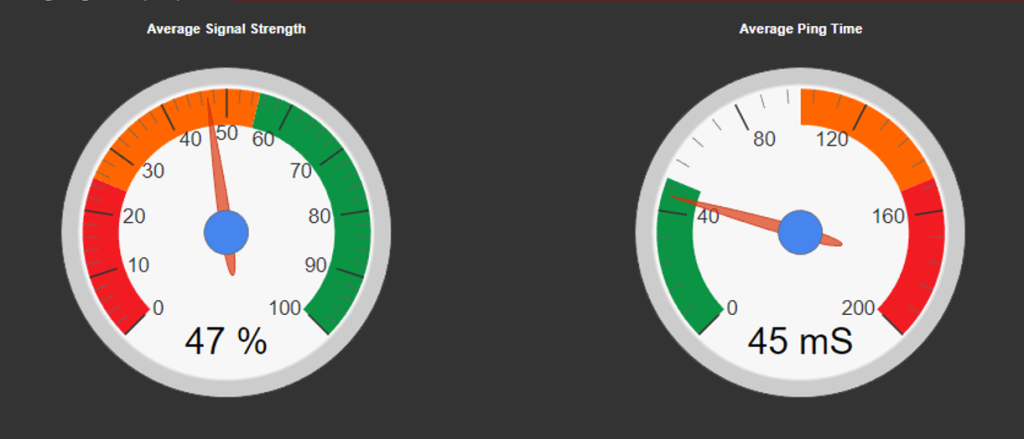
Average Signal Strength and Ping Time

Average cellular signal strength and ping time measurements are crucial since they reveal details about the quality and dependability of a cellular network connection. Ping time quantifies the amount of time it takes for a short data packet to go from the device to a remote server and back, whereas average cellular signal strength refers to the average strength of the signal received by the SENTRY from the registered cell tower.

These indicators can be measured to assist mobile users and network administrators in identifying potential network coverage problems, signal interference problems, or other potential cellular connection quality concerns. By using this data, network setups can be improved and optimised, which includes antenna placement and selection.

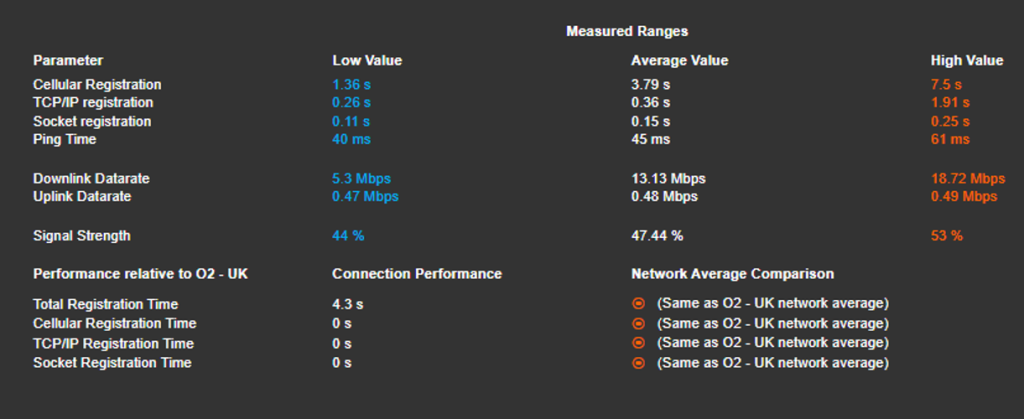
Data Summary

  • Comprehensive survey summary.
  • Compare measured network performance.
  • Identify the highest performing cells.
  • Numerical data representation of performance graphs.

Using the SENTRY, you can observe the data on a cellular network connection that can help identify areas of poor network performance and take corrective measures to improve it. Network performance is vital in IoT applications and can be characterised by monitoring network parameters.  One example might be to compare data transfer speeds compared with signal strength received over a length of time to determine the affect that signal has on the data throughout.

In addition by measuring the ranges of values over time you are able to determine the best and worst examples of each parameter which gives you the expected averages in addition to the peak performance for good conditions and poor performance for adverse conditions. This allows you to determine if your system will still operate as expected when the network infrastructure is underperforming.

Lastly you can compare your individual device’s operating performance ‘in situ’ with the average performance for the entire network operator (based on data received from other devices using the same network). This allows you to determine if your system is performing correctly for a given scenario.

The SENTRY is the perfect tool for choosing the right and only cellular network for your application.

SENTRY-G-LTE-4 (EU)

6 Supported Bands 4G / LTE
B1 (2100 MHz)
B3 (1800 MHz)
B7 (2600 MHz)
B8 (900 MHz)
B20 (800 MHz)
B28A* (700 MHz)

3 Supported Bands 3G / UMTS / HSPA+
B1 (2100 MHz)
B3 (1800 MHz)
B8 (900 MHz)

2 Supported Bands 2G / GSM / GPRS
B3 (1800 MHz)
B8 (900 MHz)

Mechanical Specifications
Dimensions: 93mm x 67mm x 28mm
Extended temperature range: -40 to +85°C

Physical Interfaces
3 x External LED Status indicators (Red, Green, Blue)
1 x SIM Card Reader for mini-SIM (2FF)
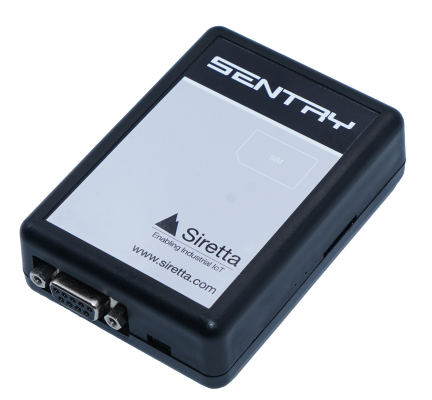
1 x RS232
1 x Mini-B USB Port
1 x Cellular Antenna SMA Connector
1 x GNSS SMA Connector
1 x RJ12 Power Connector

Power and Consumption
Power: 12V @ 1A from power supply

Certification
UKCA
CE
FCC (TBC)
RoHS
REACH

Datasheets

SENTRY Datasheet
CloudSURVEY Datasheet

Quick Start Guides

SENTRY-G-LTE4 Quick Start Guide

Hardware Manuals

SENTRY Hardware User Manual

Software Manuals

SirettaSPARK User Manual
CloudSURVEY User Manual

Software Downloads

Register to download the SirettaSPARK Tool

Additional Documents

Siretta Device Safety and Product Care

Ordering Information

Siretta Part Number: 61959
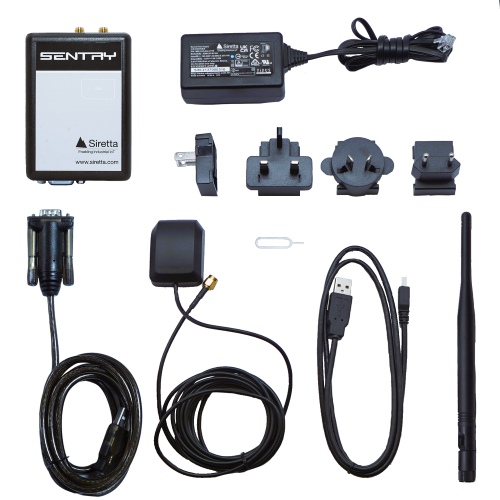
Description: SENTRY-G-LTE4 (EU) Network Signal Analyser & Data Logger with Accessories

Request For Quote

Siretta Part Number: 61958
Description: SENTRY-G-LTE4 (EU) Network Signal Analyser & Data Logger (Unit Only)

Request For Quote

Siretta Part Number: 62207
Description: SENTRY 2A FUSED PIGTAIL 5M

Request For Quote

How many tokens does a survey use?

Depending on the coverage area you plan to analyse, certain factors will need to be considered:

Static Surveys: If a SENTRY or SNYPER is in one static location, Then the cells detected in theory should be the same +/- 10%. For a small town and depending on density, 30 cells maybe found across all technologies, so 30 tokens will be consumed.

Dynamic Surveys: If a SENTRY or SNYPER is constantly on the move, Then the cells detected will be alot more. As a usage example we made a trial run from our office based in Reading UK travelling to Manchester covering 218 Miles we detected 1602 cells. In turn CloudSURVEY will deduct 1602 tokens from your account to access the cell mapping information.

I want to run my SENTRY in “Performance” mode, is there a recommended SIM card?

We advise if you are constantly analysing network performance e.g. Speed, Ping etc, it is suggested to utilise a SIM with a generous data allowance.

How long will the SENTRY last on a 12V battery?

A small 12 V car battery with a rating of 60 Ahr should power the SENTRY for at least 40 days if fully charged.

What can I do with the supplied 5M fused pigtail?

Using a 12 V lead acid vehicle or alarm panel battery is useful where the SENTRY is being used in remote locations where there is no availability of mains power. A small 12 V car battery with a rating of 60 Ahr should power the SENTRY for at least 40 days if fully charged.

Why is there a 1NCE SIM card included with your starter kits?

Our engineering department has been using 1NCE SIM’s during the R&D of the SENTRY so we are 100% certain the SENTRY device works correctly. This test SIM will help in support calls if you are using another brand of SIM and having some connectivity issues.

Close Menu