

For people in the IoT world, terms like VSWR, Return Loss and Polarization are ubiquitous. But if you are new to IoT and want to enable an IoT connection for your product, looking through datasheets at all the charts, graphs, plots and tables when choosing the right antenna to design into your application, might seem a bit daunting. Not to worry, we are here to help!
Let’s take a look at the term ‘Return Loss’. When transmitting a signal through a transmission line, some of the signal power is reflected and returned to the source. This is often caused by an impedance mismatch between the device and the antenna.
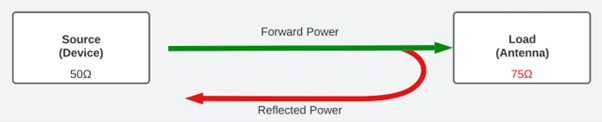
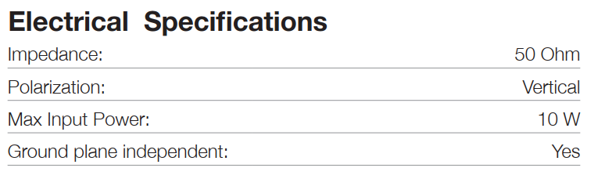
Reflected power is almost always undesirable and too much of it can damage the source so it’s important to make sure the impedances of your source and load are matched. You can check the Electrical Specification section of a Siretta datasheet for antenna impedance (usually 50 Ω).
So, what does this have to do with Return Loss?
Return Loss is essentially the ratio of the reflected power to the forward power in decibels (dB). A lower Return Loss means less power is reflected from the load and is usually a desirable outcome. A higher Return Loss means more power has been reflected back from the load. This usually means that there is an impedance mismatch at the load.
Take a look at the Return Loss chart below for one of our dual band Wi-Fi antennas which performs really well around the 2.4 GHz and 5.8 GHz marks. If we look at the Return Loss chart for this antenna, we can see a correspondingly low Return Loss at those frequencies (keep in mind that the values shown are negative).
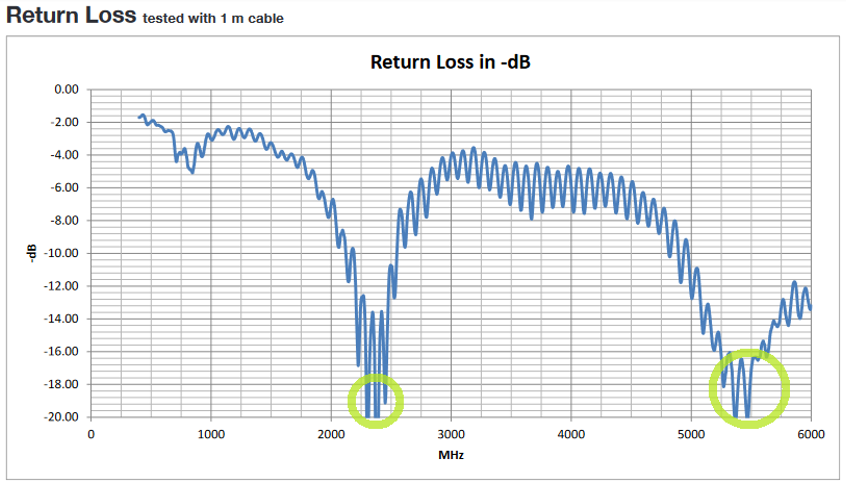
So, when looking for an antenna and you know what frequencies you are going to be working with, make sure you refer to the Return Loss chart so that you can minimize the amount of reflected power in your application.
Another useful measure of an antenna’s performance across frequency and one that is also featured in our new datasheets is VSWR.
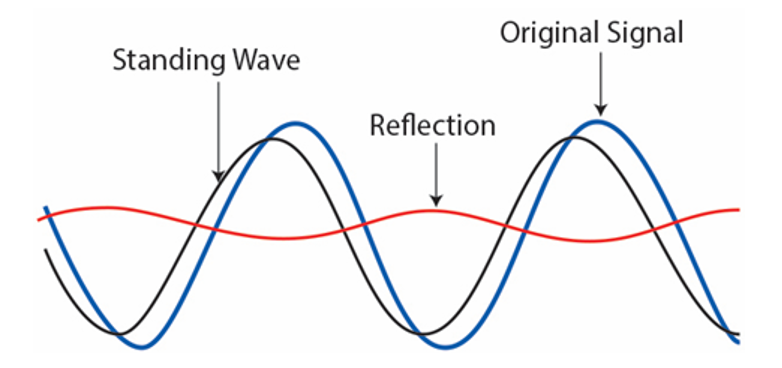
Voltage Standing Wave Ratio is a term used to describe how well the impedance is matched in an antenna. It’s the ratio of the maximum voltage to minimum voltage in a standing wave. But what is meant by a standing wave?
It’s a waveform that is created when an input waveform (shown in blue in the graph below) is altered by the reflected portion of that input waveform (the red line on the graph).
The VSWR value is calculated by dividing the maximum value of the resulting standing wave by its minimum value.
Now because impedance varies across frequency, so will the VSWR of an antenna. That’s why we have included in our datasheets a graph that plots VSWR across frequency, from 0 to 6 GHz.
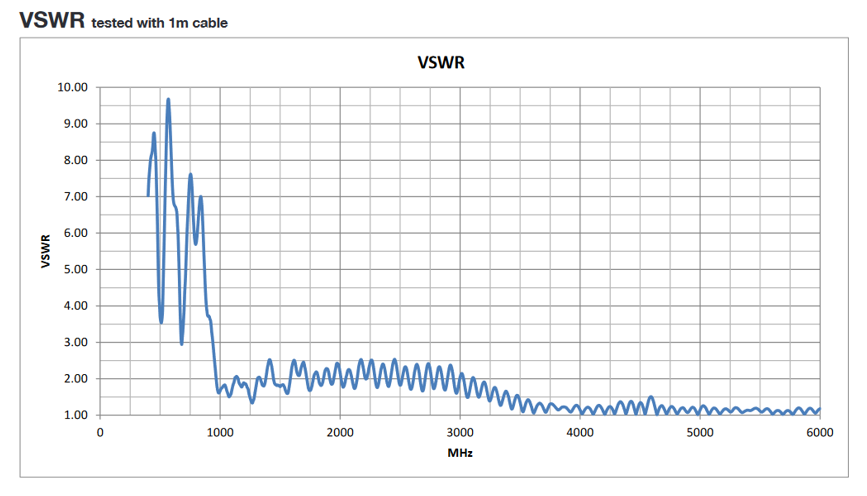
The ideal scenario for optimum performance of your equipment is a VSWR that never increases above 2, so if you know what frequencies you are going to be working with, make sure you refer to the VSWR chart of an antenna datasheet so that you can get the most efficient power transmission possible!
