2D Radiation Plots
Frequency of Interest and Standard Plot Cuts – Interpretation and Further Analysis.
Below, we show how to read the 2D Radiation charts, on our datasheets, to determine the performance provided for a frequency band.
Overview
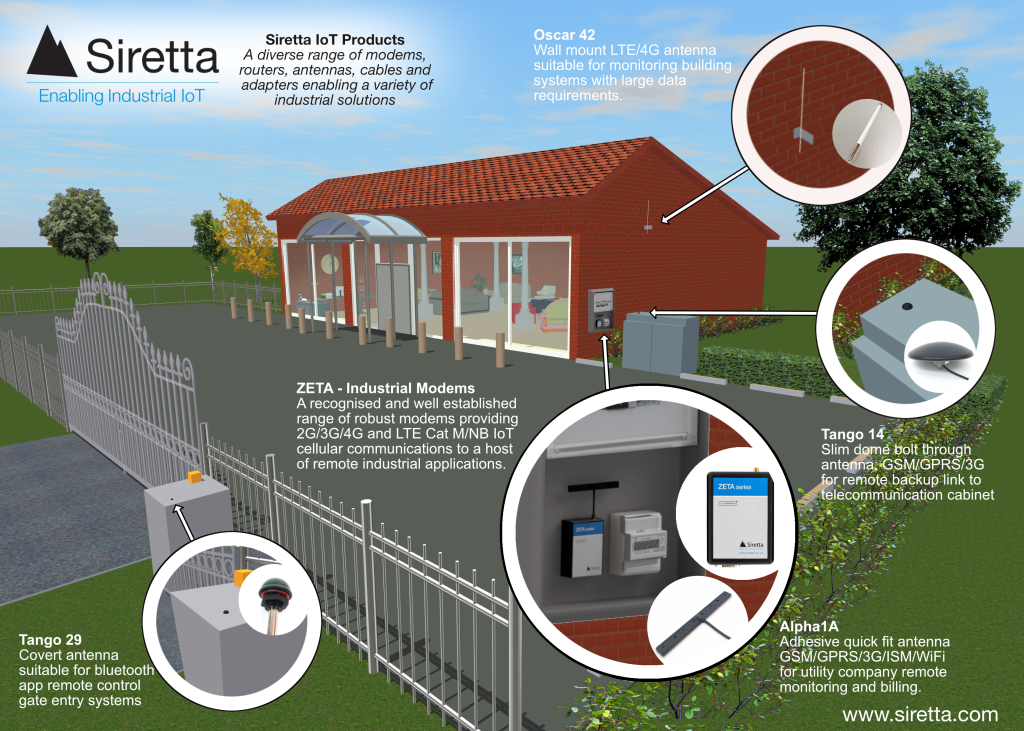
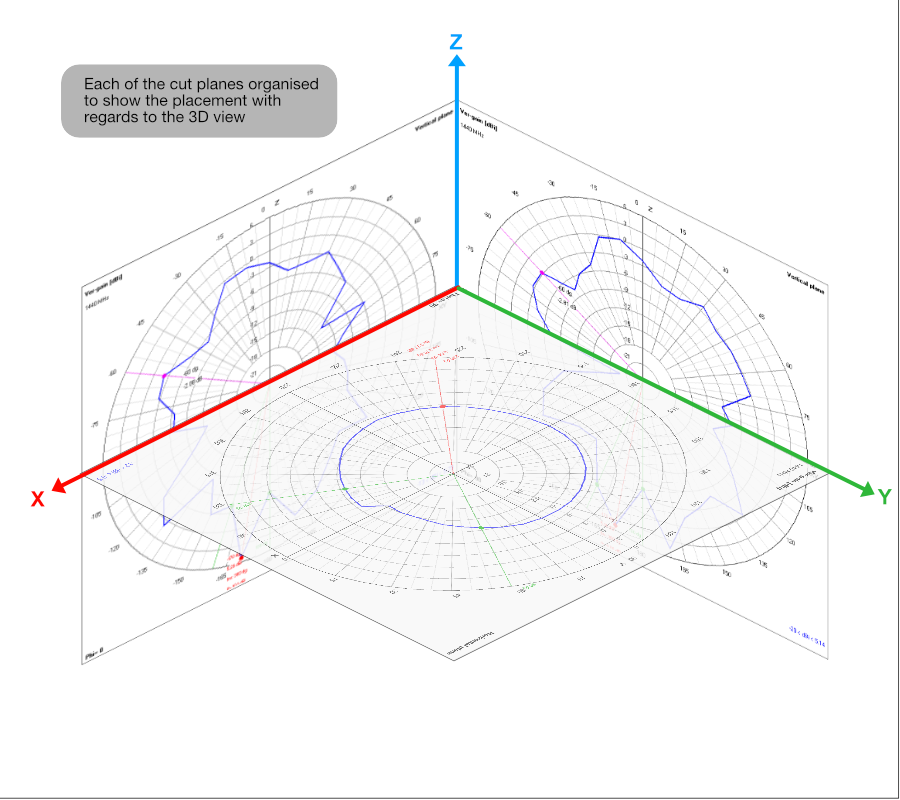
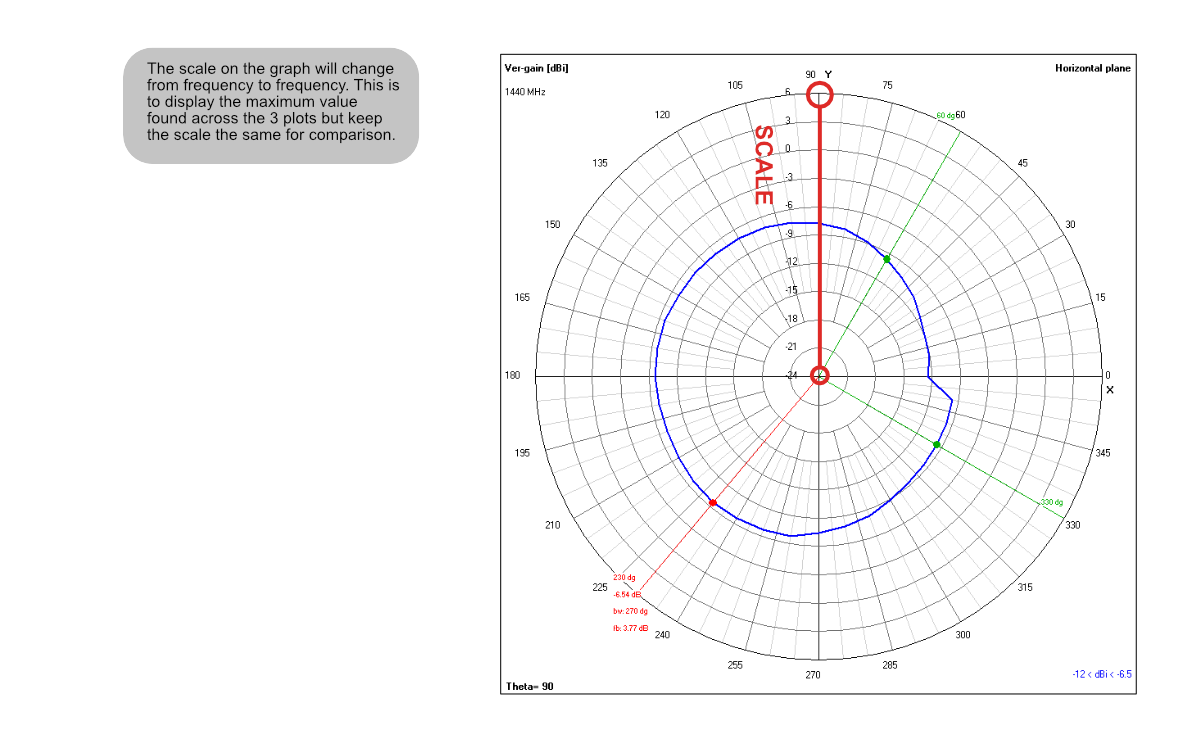
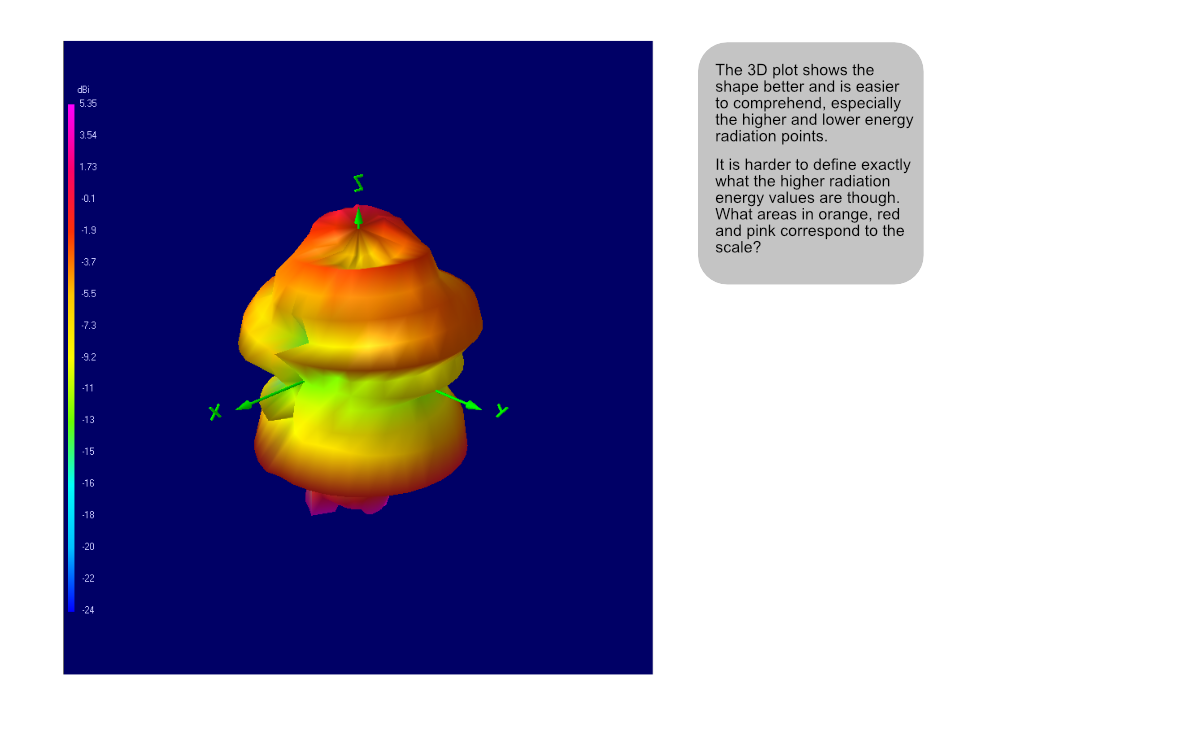
There are two types of radiation plot provided from the same data. The 2D representation is a standard spherical data format used by test laboratories. This data is per IEEE Std 149 (1979) ‘IEEE Standard Test Procedures for Antennas’ and uses the Phi axis rolling as per the ‘Great Circle Cut System’. Each of the standard datasheet cut planes may miss key information, as the maximum radiation point may not be present in the cut. The 3D plot shows an overview of the radiation energy at the spot frequency which is easier to visualise.
1440 MHz
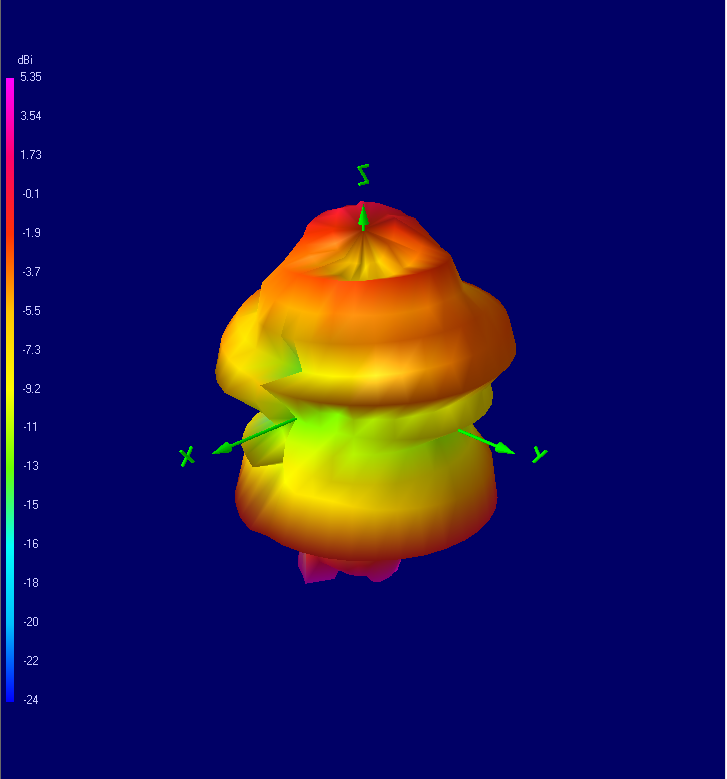
1440 MHz XY XZ YZ

1440 MHz
1440 MHz XY XZ YZ
We can see from the two vertical cuts that the maximum radiation is better than displayed in the XY Horizontal plot. The 2 vertical cuts, in themselves, may also miss points that have better radiation at different angles. The 2D standard antenna plots only give a general indication of total performance and many plots are required to gain some insight into the overall performance. They are, however, more useful in determining values at specific points than the 3D plots.
The combination of the two different types of radiation plot allow for a more complete understanding of how the antenna performs. For each frequency band of interest, that your device will operate on, review the plots to ascertain if the particular antenna will work for you.
Key Take-aways:
1. That 2D XY Horizontal plot does not necessarily show the highest radiated energy.
The standard laboratory cuts do not always show the highest radiated energy, they are indicative of the overall pattern. However, they
are better for obtaining more accurate radiation levels than the 3D plot.
2. The 3D Plots are good for overall visualisation but more difficult to get exact radiation figures.
Use a combination of the two plot types, 2D and 3D, to obtain a better performance overview
3. There are other key parameters to consider like, VSWR / Return Loss and Radiation Efficiency.
About Siretta – Global manufacturer of IoT Solutions
A leading manufacturer and developer of IoT products, IoT software and IoT solutions. Our specialty being in providing these for Industrial markets and business to business applications. We have extensive knowledge and experience within IoT with a focus on cellular technologies in support of 2G (GPRS), 3G (UMTS), 4G (LTE), NB-IoT and LTE Category M.
Supplying products globally for over a decade in support of many blue-chip organisations with an unrivalled level of regional and local technical expertise and applications knowledge ensures we exceed customer expectations in support of varied applications and deployments.
Our portfolio includes cellular modems & terminals, routers, cellular network analysers, RF antennas including solutions for WLAN, LoRa and Sigfox. We offer RF cable assemblies and RF accessories. Frequencies are typically within the 75MHz – 5.8GHz range covering the HF, VHF, ISM, Cellular, GNSS frequencies. We also offer bespoke customer solutions and our design services
are supported by an experienced team of dedicated development & application engineers as well as software specialists offering complete end to end solutions with a heavy emphasis on high level
system design.
We are your partner of choice in enabling your IoT solutions.